April 8th, 2026
New
Beyond Crash Rates: Build dashboards around your product
We're excited to announce Custom Dashboards, now live in Spotflow.
Until now, Spotflow offered pre-built dashboards for fleet health and per-device diagnostics. Custom Dashboards expand on this by letting you create tailored views for any aspect of your device fleet — including product usage and user behavior through your custom application metrics.
What you can do:
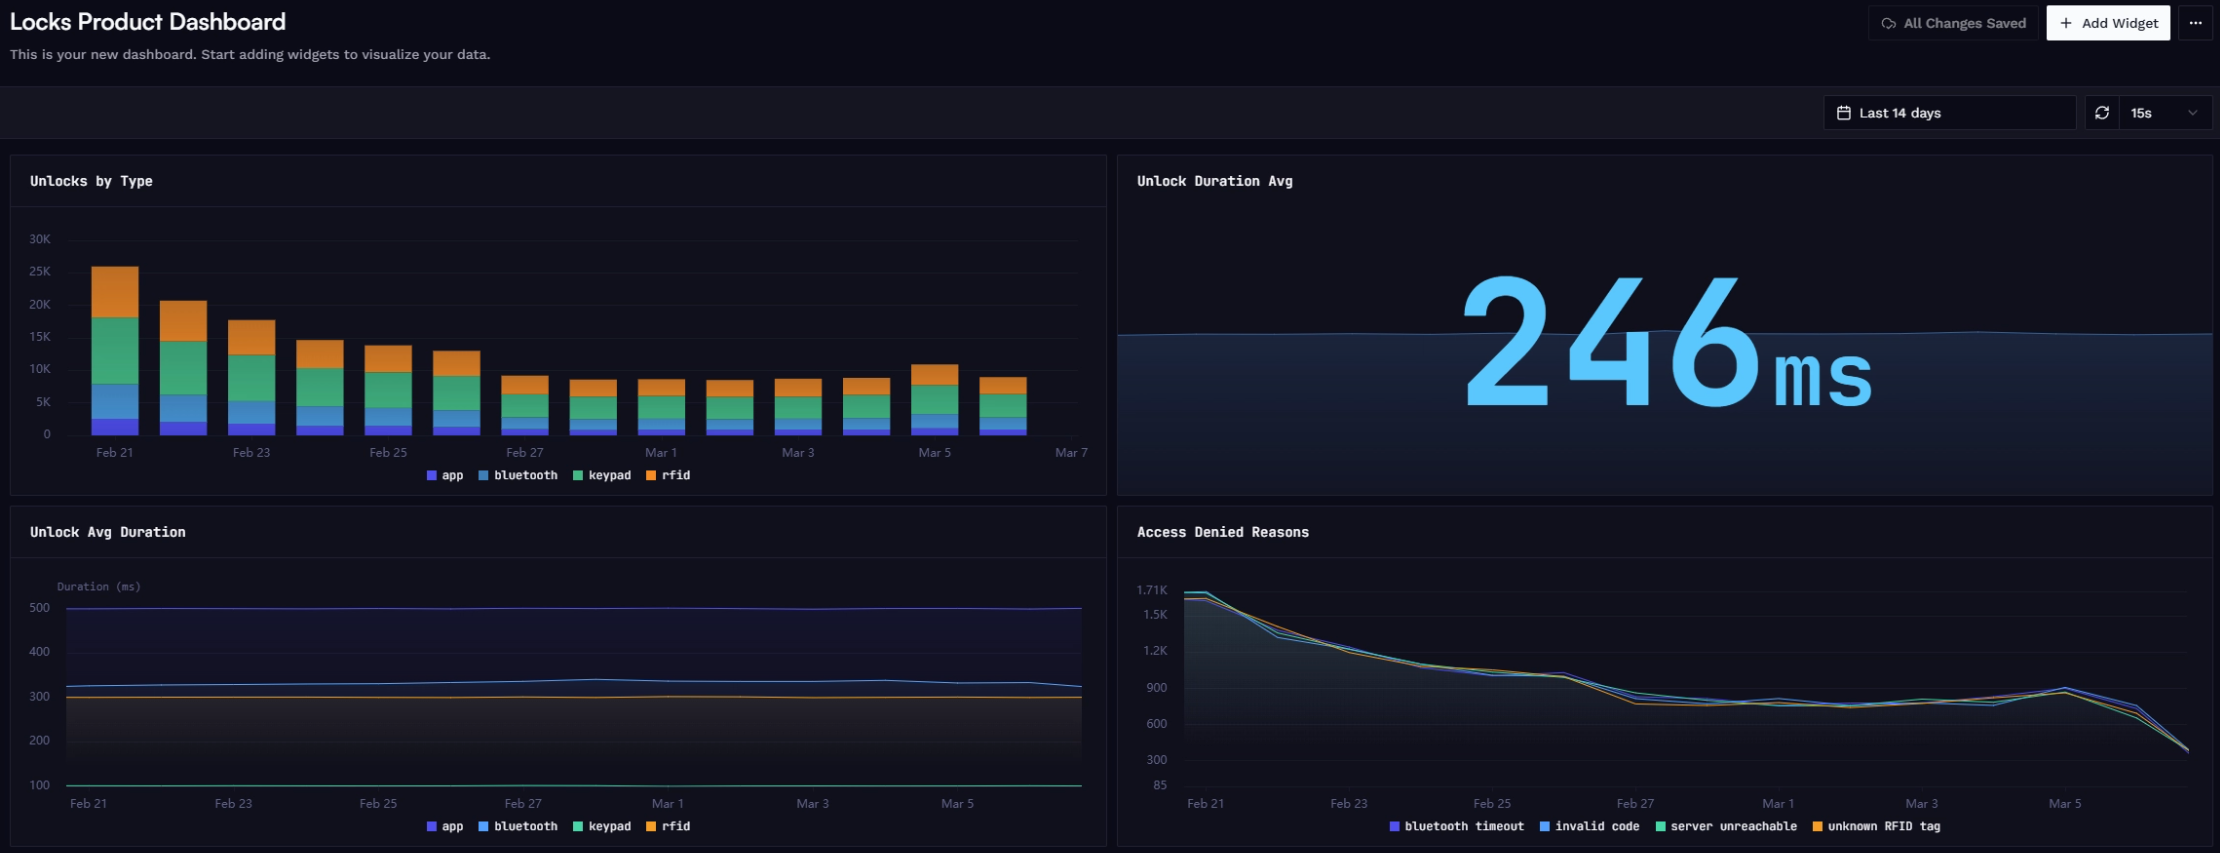
Create multiple dashboards — each with a name and optional description, organized around your team's specific needs
Add premade widgets — the same fleet health widgets you already know: connectivity, crash rate, firmware distribution, resource usage, and more
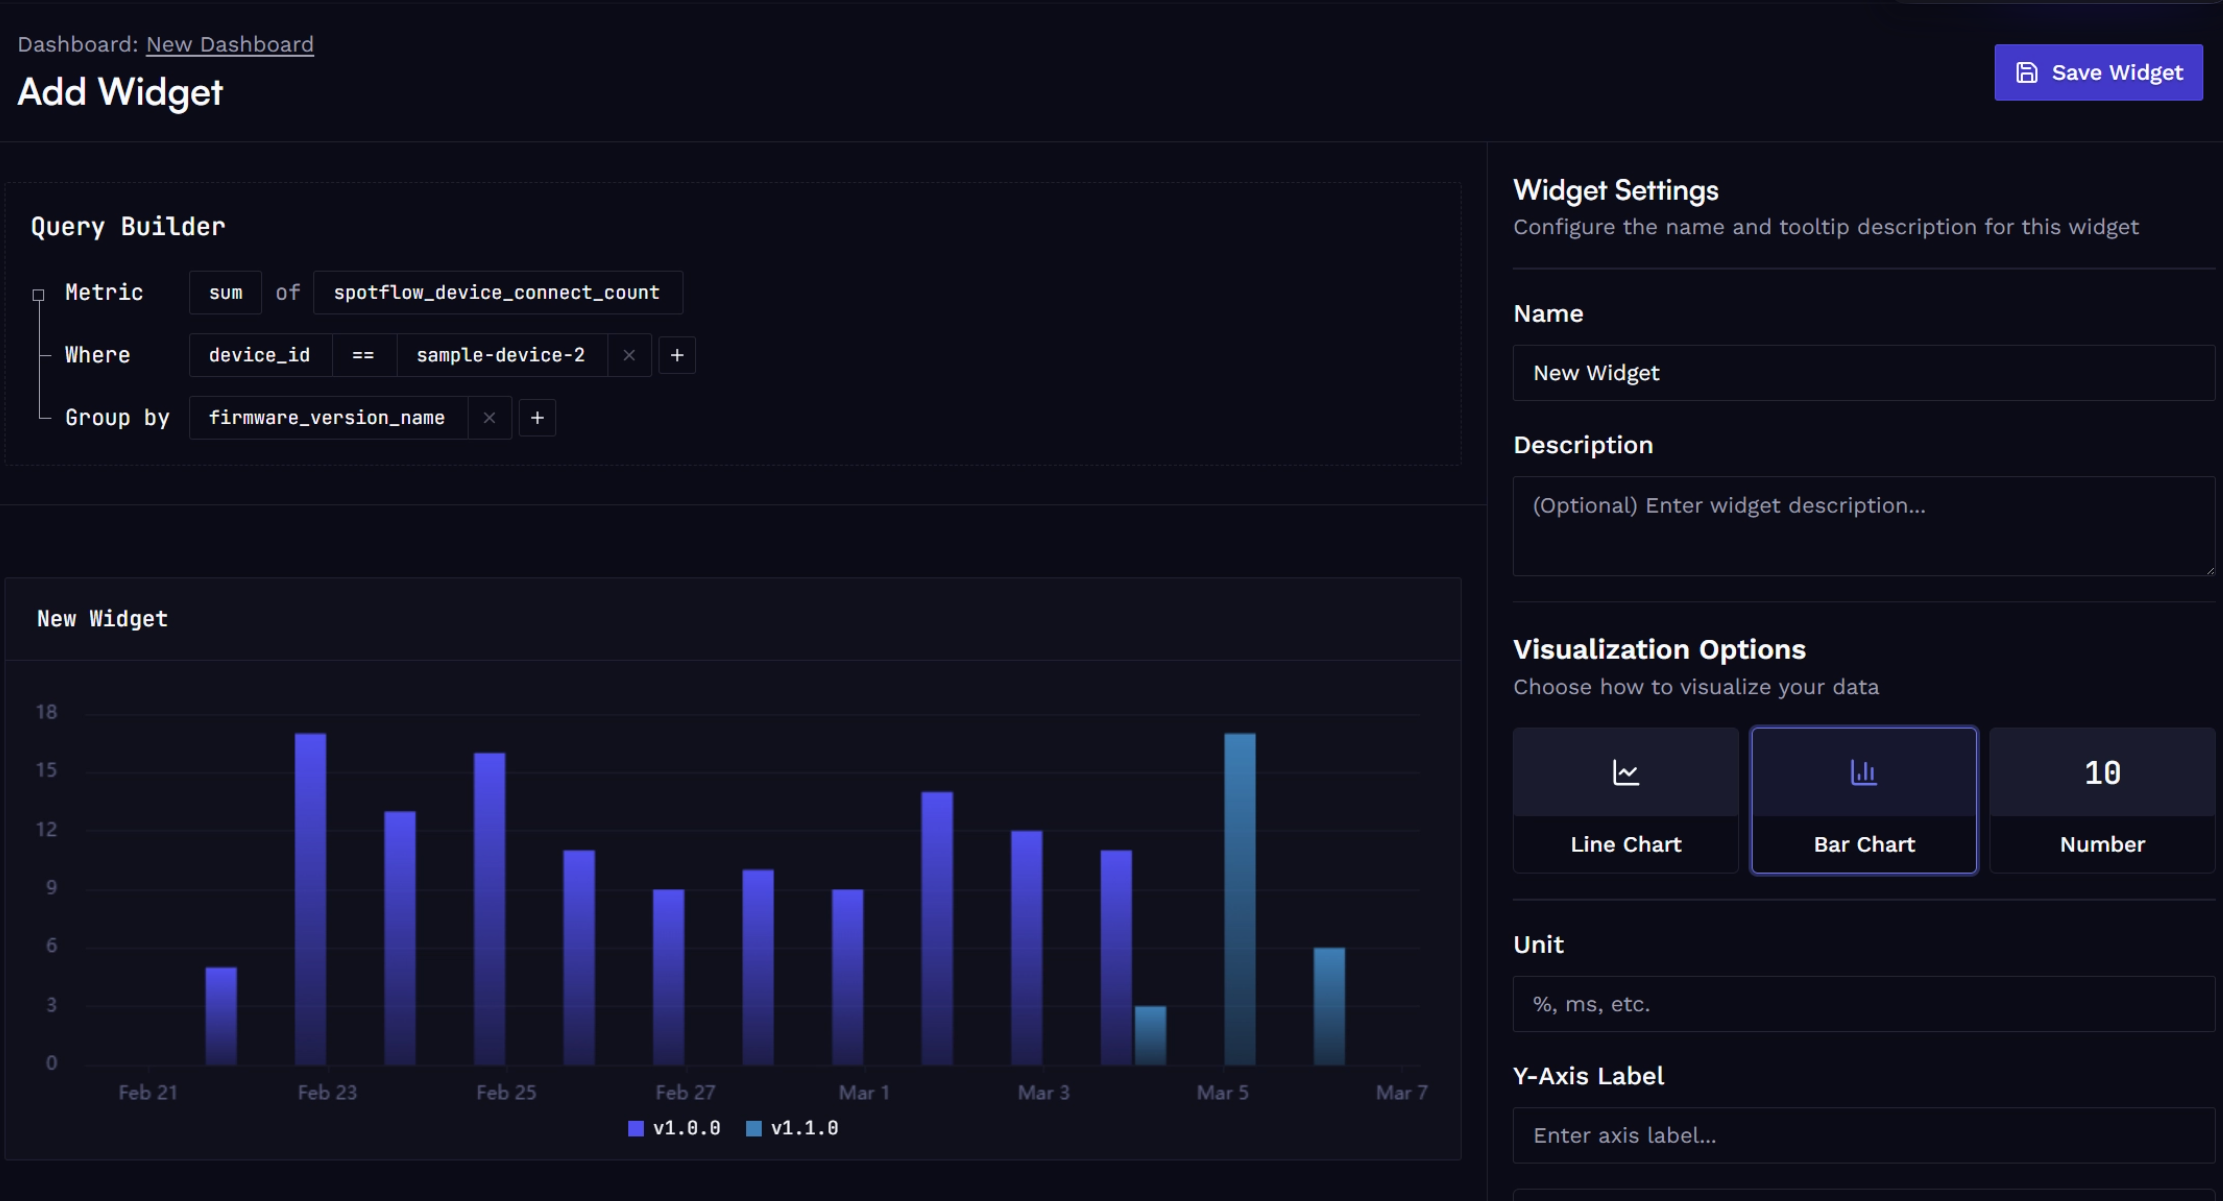
Add custom widgets — query any metric (Spotflow-provided or custom), apply filters and grouping by built-in or custom labels, and choose your preferred visualization type and units
Manage and evolve dashboards — resize and rename widgets, add or remove them at any time, configure time range and auto-refresh frequency
Why it matters:
Embedded teams often track device stability in one tool and product analytics in another. Custom Dashboards bring these together — so you can see how a firmware rollout affects not just crash rates, but actual feature adoption, all in the same place.
Check here on how to get started: https://docs.spotflow.io/guides/custom-dashboards