April 28th, 2026
New

We're excited to announce Alerting, now live in Spotflow.

You've been able to monitor the health of your embedded device fleet using Spotflow's dashboards.
Now Spotflow can proactively alert you when something needs your attention.

What’s new:
Metric-based alert rules: define rules on System Metrics (CPU usage, memory usage) or Custom Application Metrics (battery level, operation duration, error counts, anything your firmware reports)
Threshold conditions: alert when a metric crosses a fixed value, e.g., CPU above 90%
Percentual Change conditions: alert when a metric shifts significantly over time, e.g., battery voltage drops 20%
Offline detection: trigger an alert when no data is received from a device, great for catching devices that have gone silent
Configurable evaluation intervals: control how frequently each rule is checked
Custom alert tags: tag your alerts for easy triaging in the alert list
Notification Targets: define a group of email addresses once and reuse it across multiple alert rules
Automatic resolution: alerts resolve on their own once the condition clears, no manual action needed
👉 Overview: https://docs.spotflow.io/fundamentals/alerts
👉 Using Alerting: https://docs.spotflow.io/guides/alert-rules
April 8th, 2026
New

We're excited to announce Custom Dashboards, now live in Spotflow.
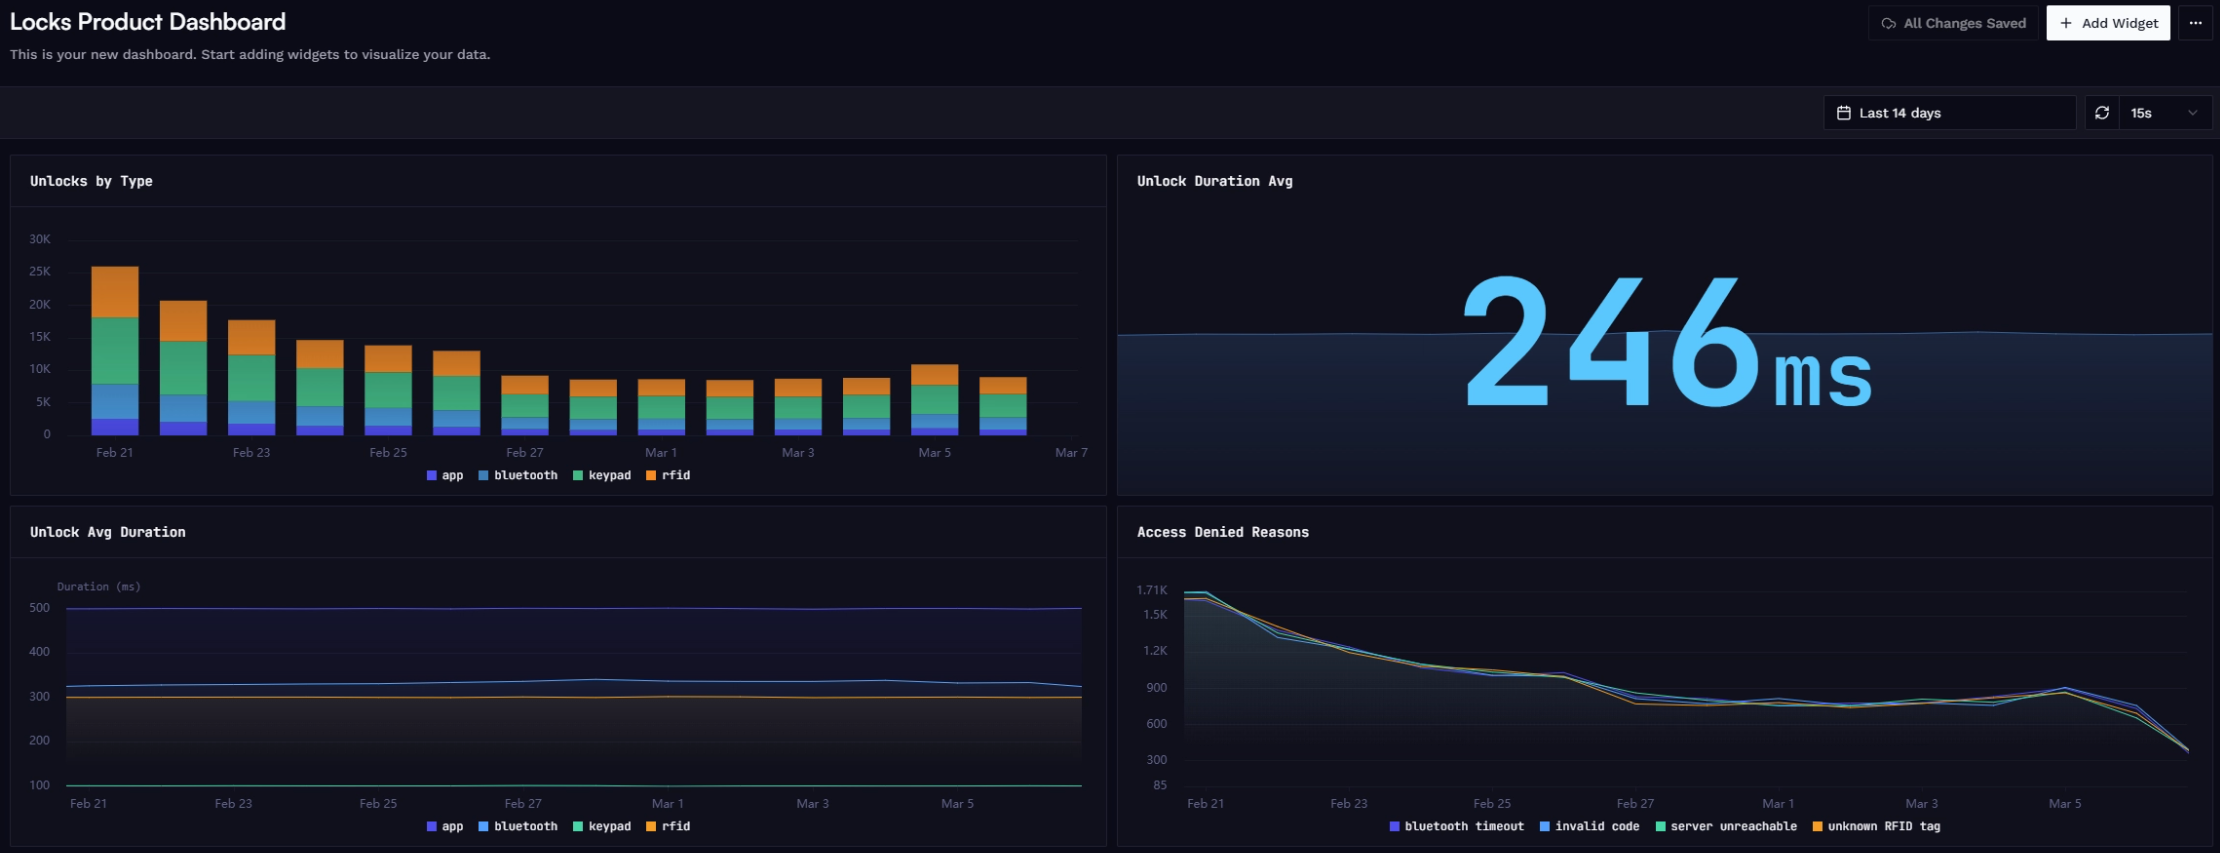
Until now, Spotflow offered pre-built dashboards for fleet health and per-device diagnostics. Custom Dashboards expand on this by letting you create tailored views for any aspect of your device fleet — including product usage and user behavior through your custom application metrics.
What you can do:
Create multiple dashboards — each with a name and optional description, organized around your team's specific needs
Add premade widgets — the same fleet health widgets you already know: connectivity, crash rate, firmware distribution, resource usage, and more
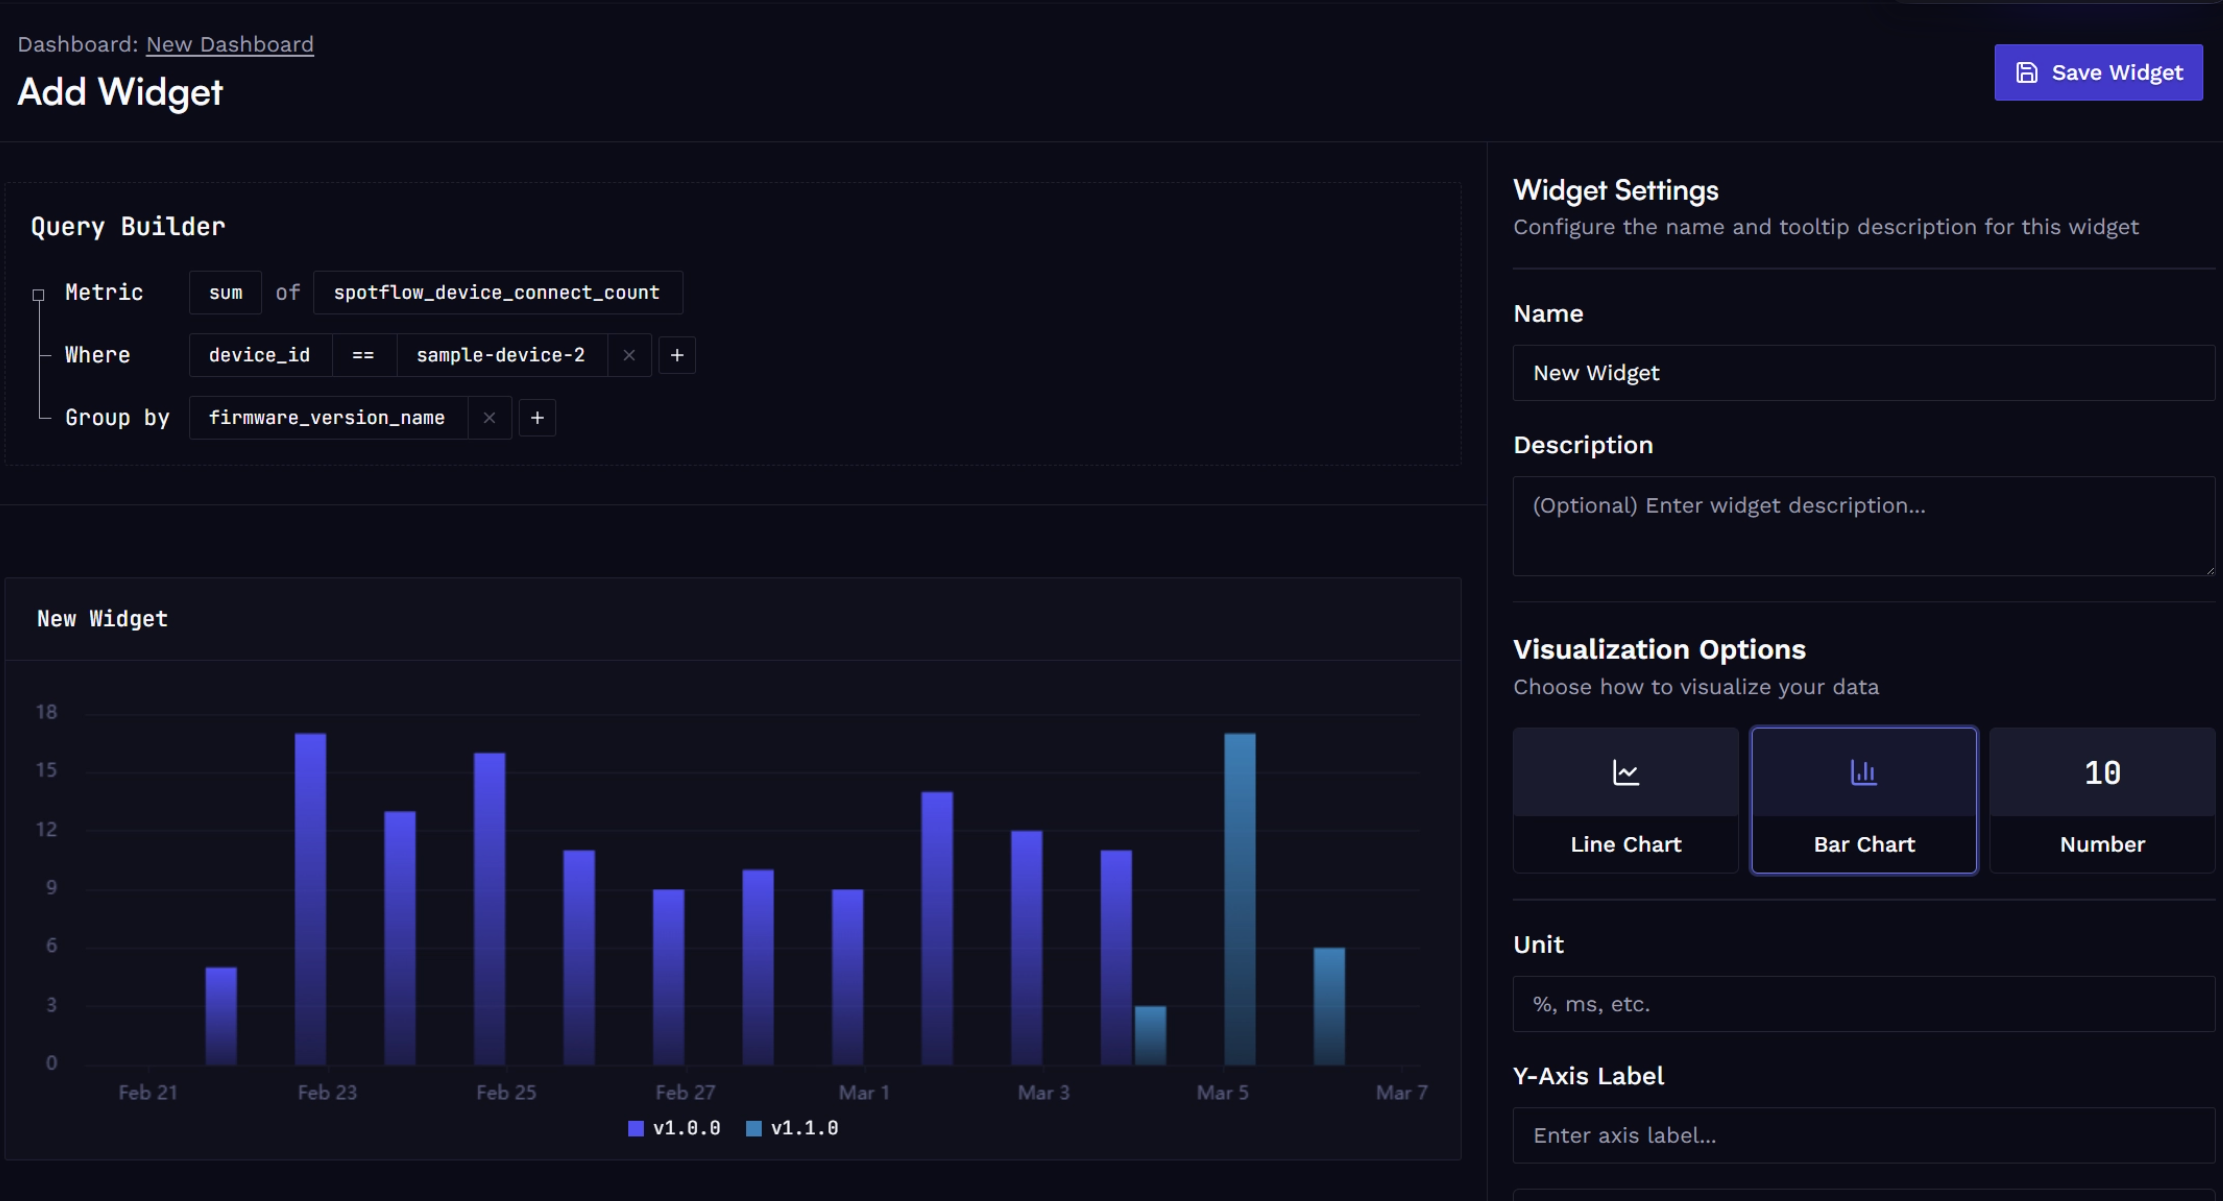
Add custom widgets — query any metric (Spotflow-provided or custom), apply filters and grouping by built-in or custom labels, and choose your preferred visualization type and units
Manage and evolve dashboards — resize and rename widgets, add or remove them at any time, configure time range and auto-refresh frequency
Why it matters:
Embedded teams often track device stability in one tool and product analytics in another. Custom Dashboards bring these together — so you can see how a firmware rollout affects not just crash rates, but actual feature adoption, all in the same place.
Check here on how to get started: https://docs.spotflow.io/guides/custom-dashboards
February 10th, 2026
New

We’re introducing 2 dashboards that help you understand what’s happening across your device fleets.
Fleet overview dashboard
Device overview dashboard
Fleet overview dashboard
Use it when you’re monitoring day-to-day operations, validating a rollout, or responding to a report like “devices started rebooting” or “telemetry dropped”.
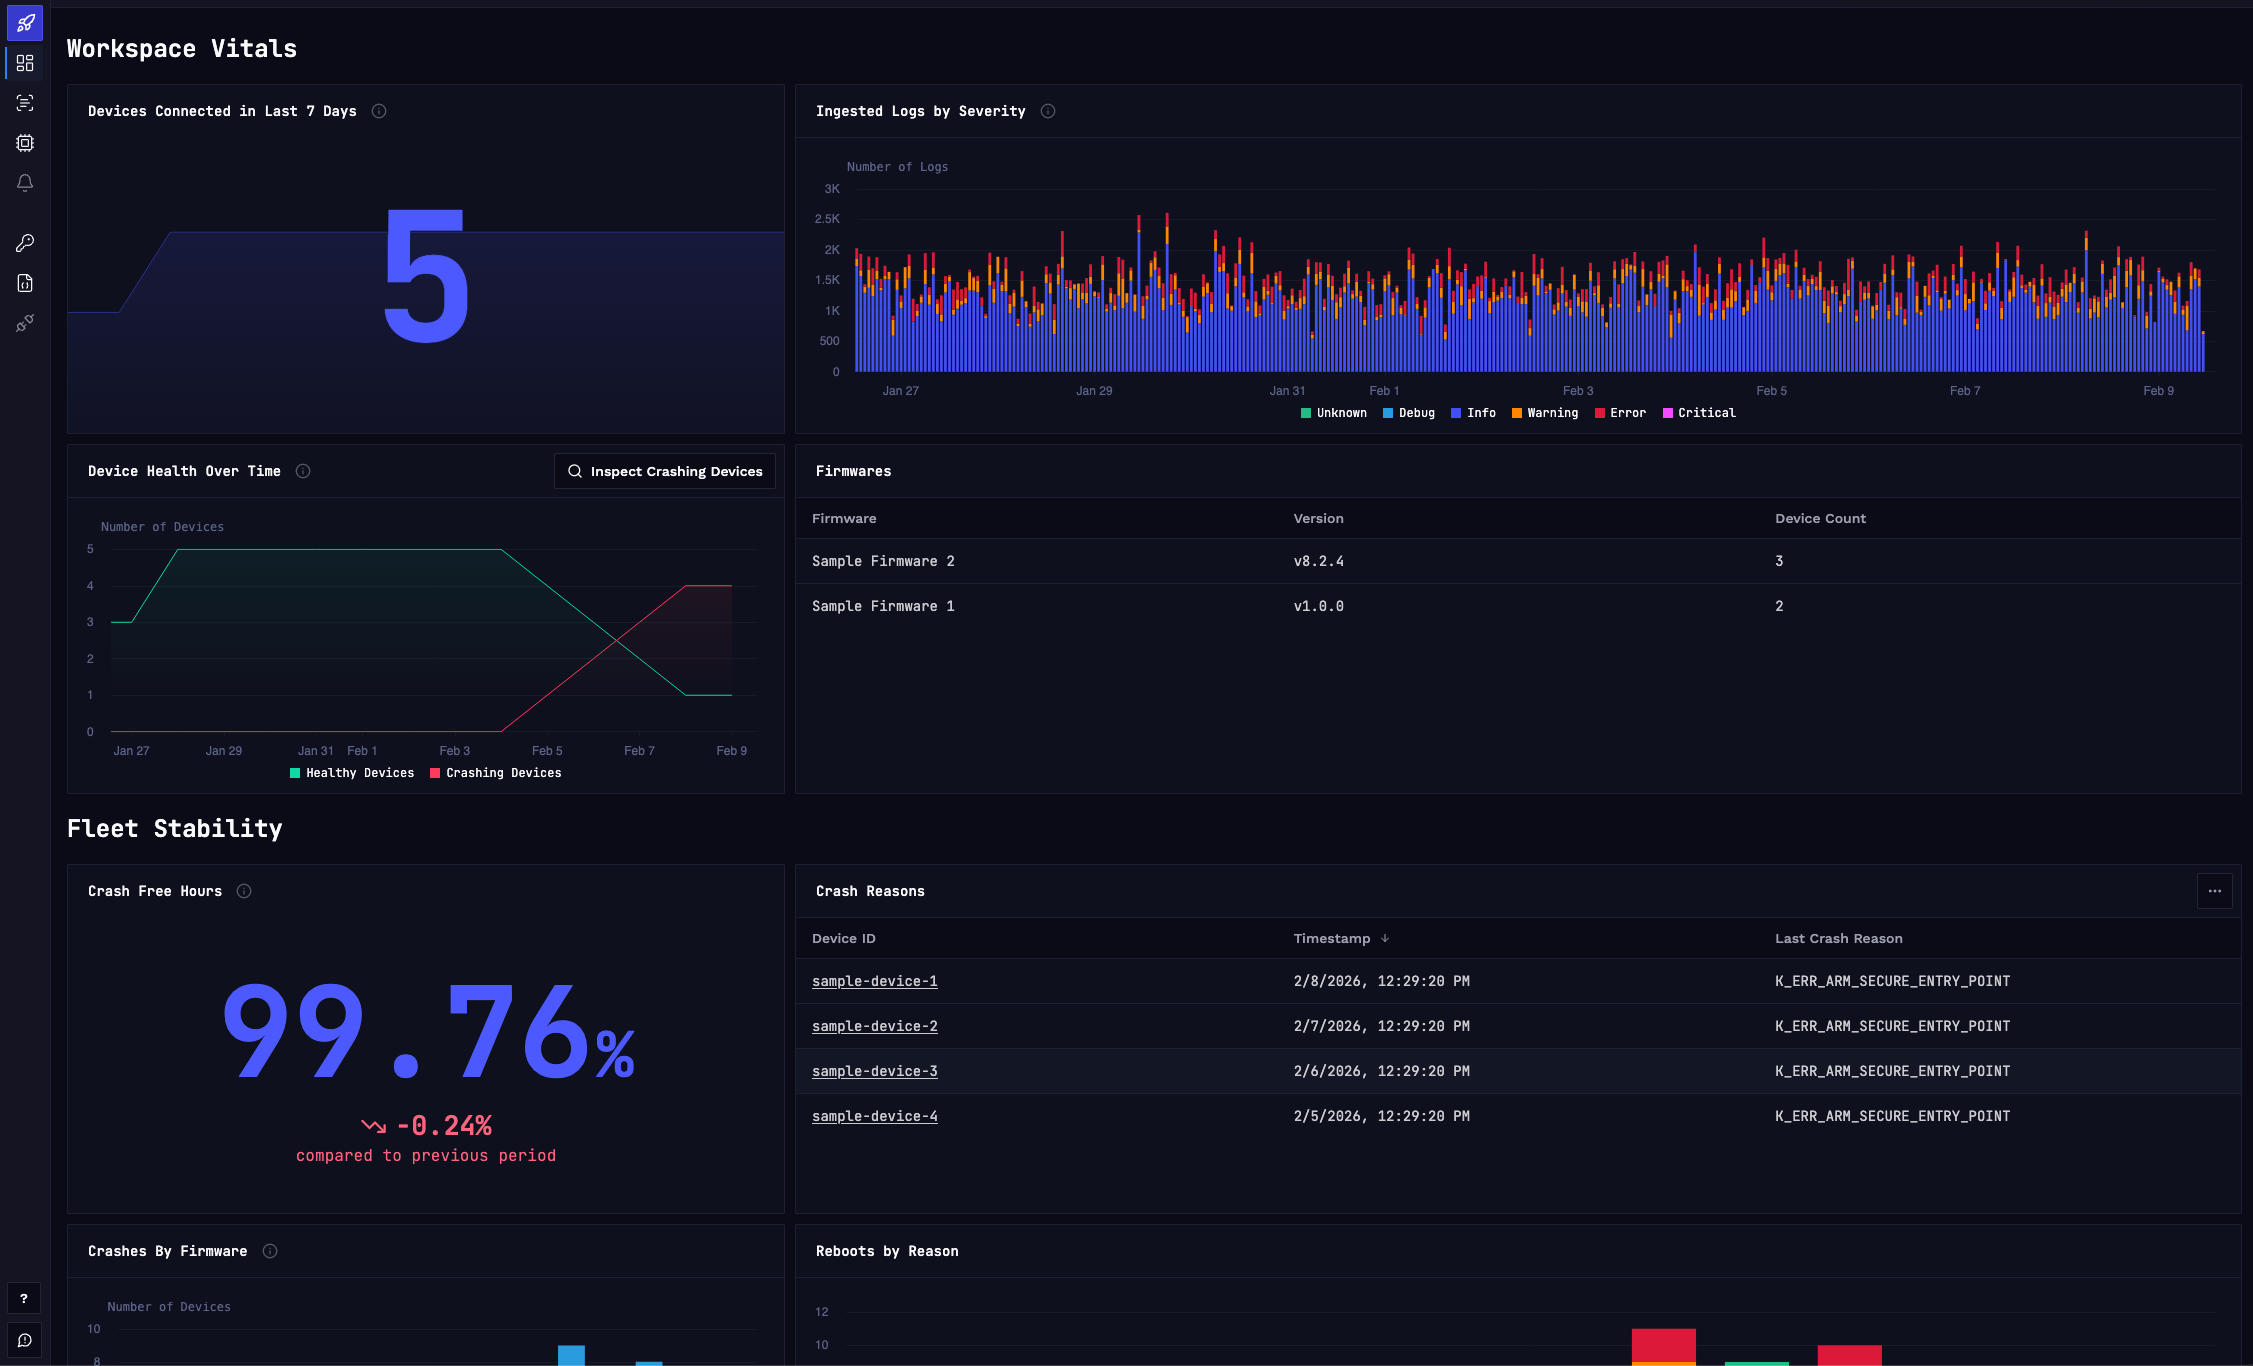
It helps you answer questions like:
Are devices connecting as expected?
Are crashes increasing, and is it tied to a rollout?
Which firmware versions are active in the field right now?
Did something change in logs (volume or severity)?
Device overview dashboard
Seeing something fishy and need to check on a specific device? The Device overview is your go-to place for understanding how a single device behaves in the real world over time.
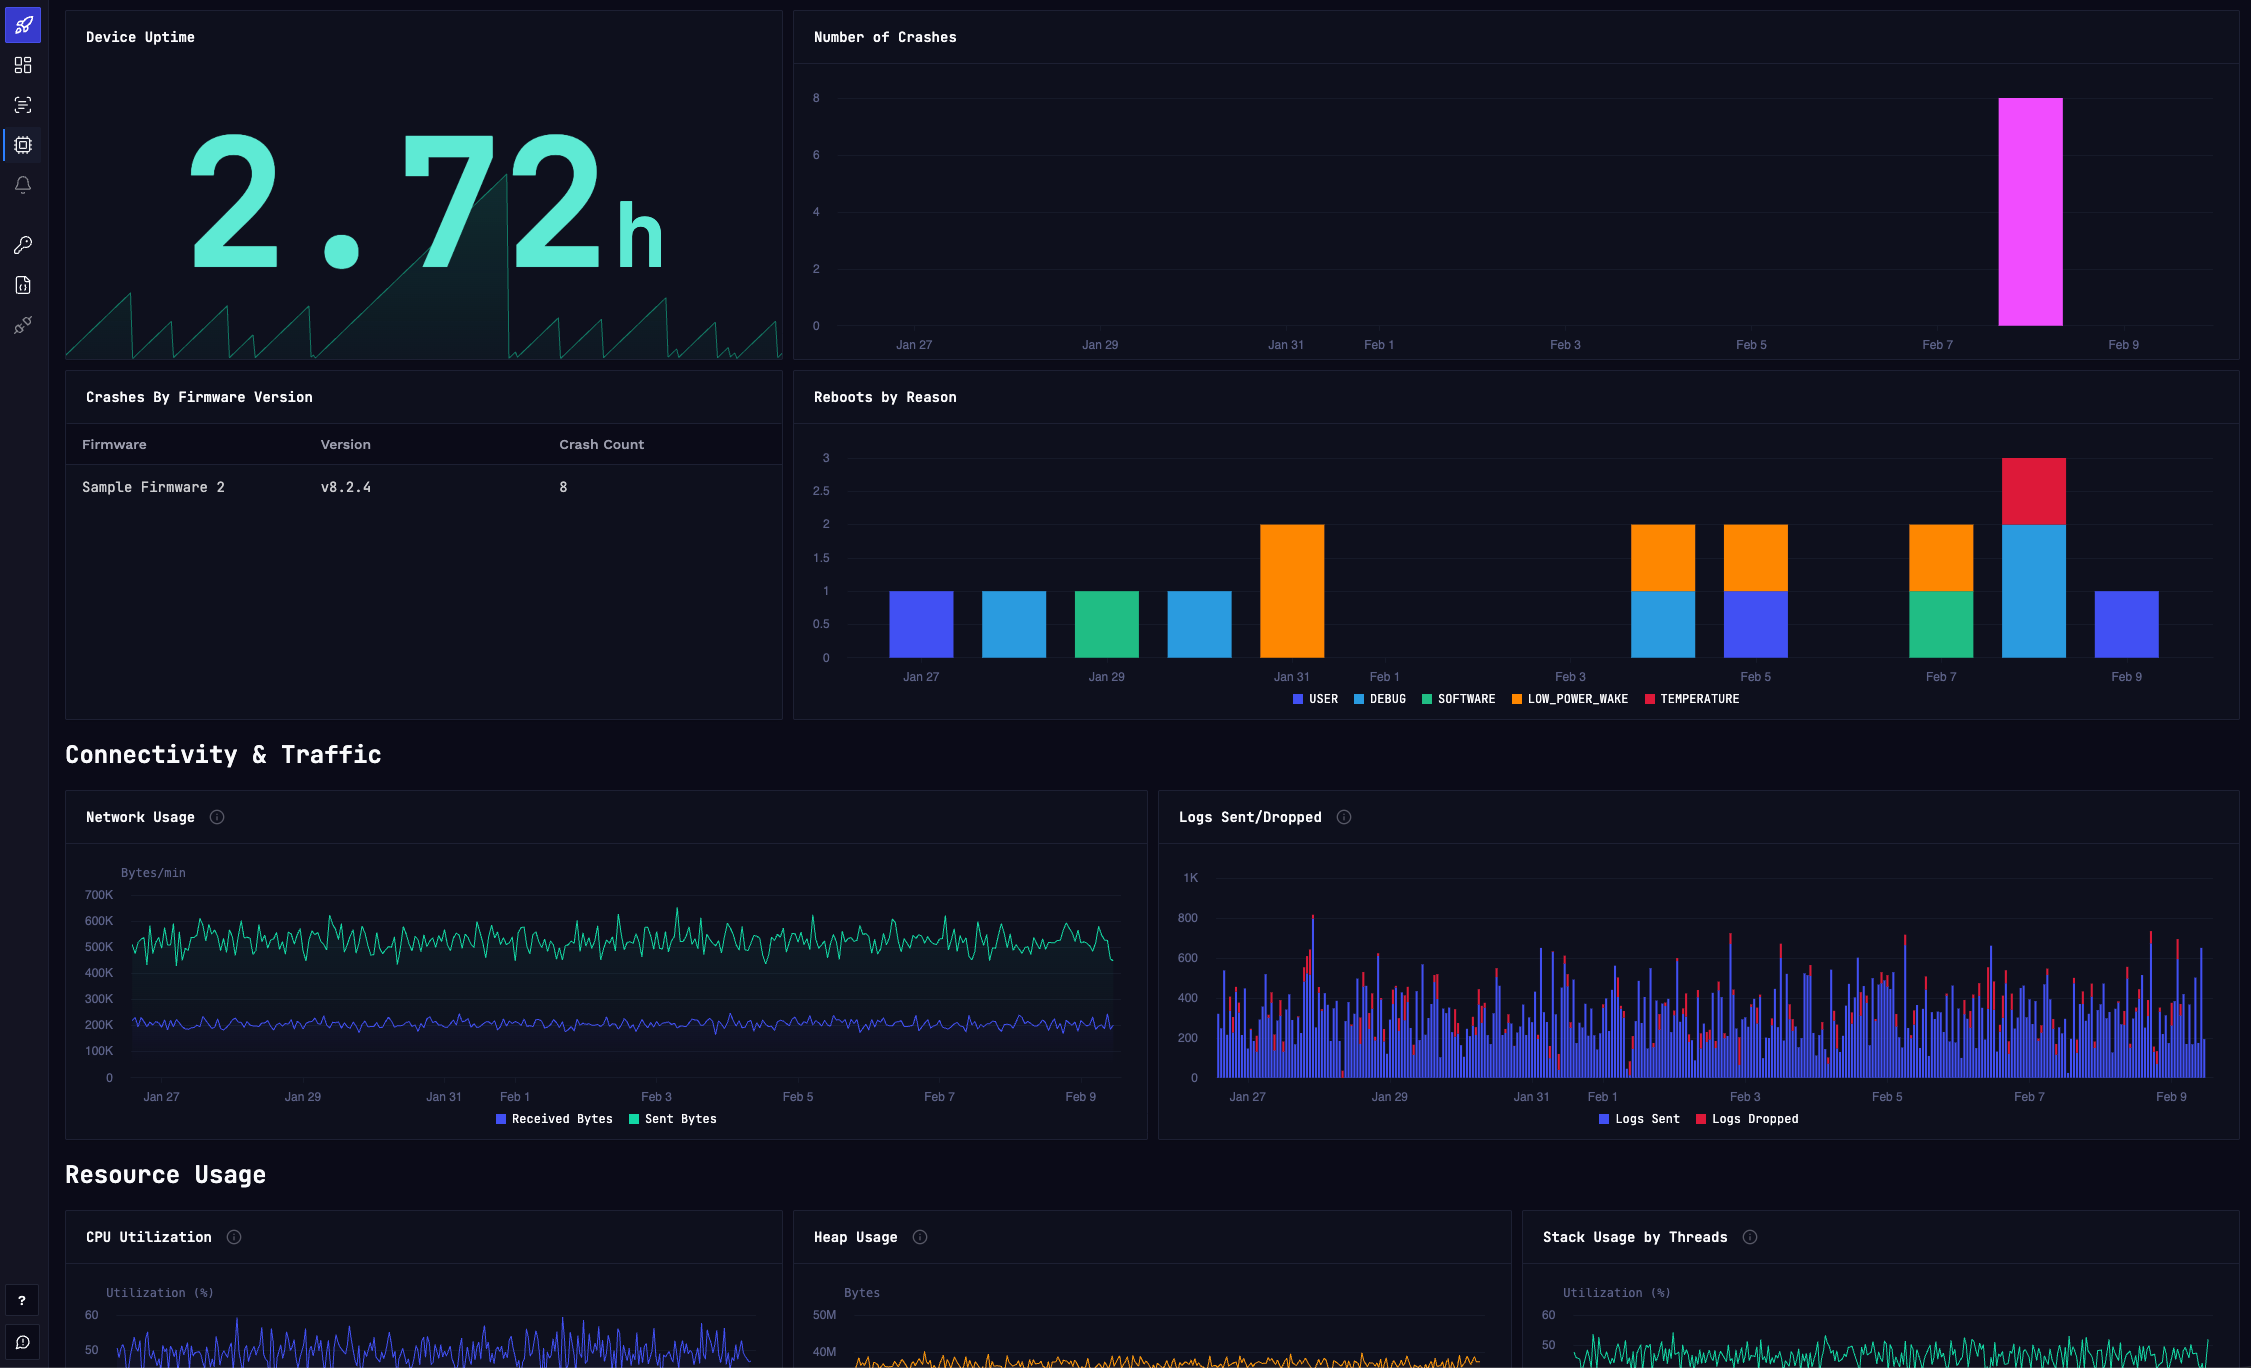
It helps you answer questions like:
Is this device stable?
Did a recent firmware update introduce crashes?
Is the device communicating reliably with the cloud?
Are we running close to CPU or memory limits?
Zephyr OS metrics are automatically collected by our device module, which runs alongside your firmware on the device. No coding needed!
The dashboards are now available for all plans, including the Free tier.
Want to learn more? Check our documentation.
Have any feedback? Join our community.
October 29th, 2025
New
You can now set the log level directly from the Spotflow web interface, without needing to modify firmware and redeploy.
Only logs above the selected level are sent to the cloud, so you can:
Cut down data transfer
Turn up verbosity remotely when troubleshooting
Keep your logging verbosity consistent according to the needs of your environment
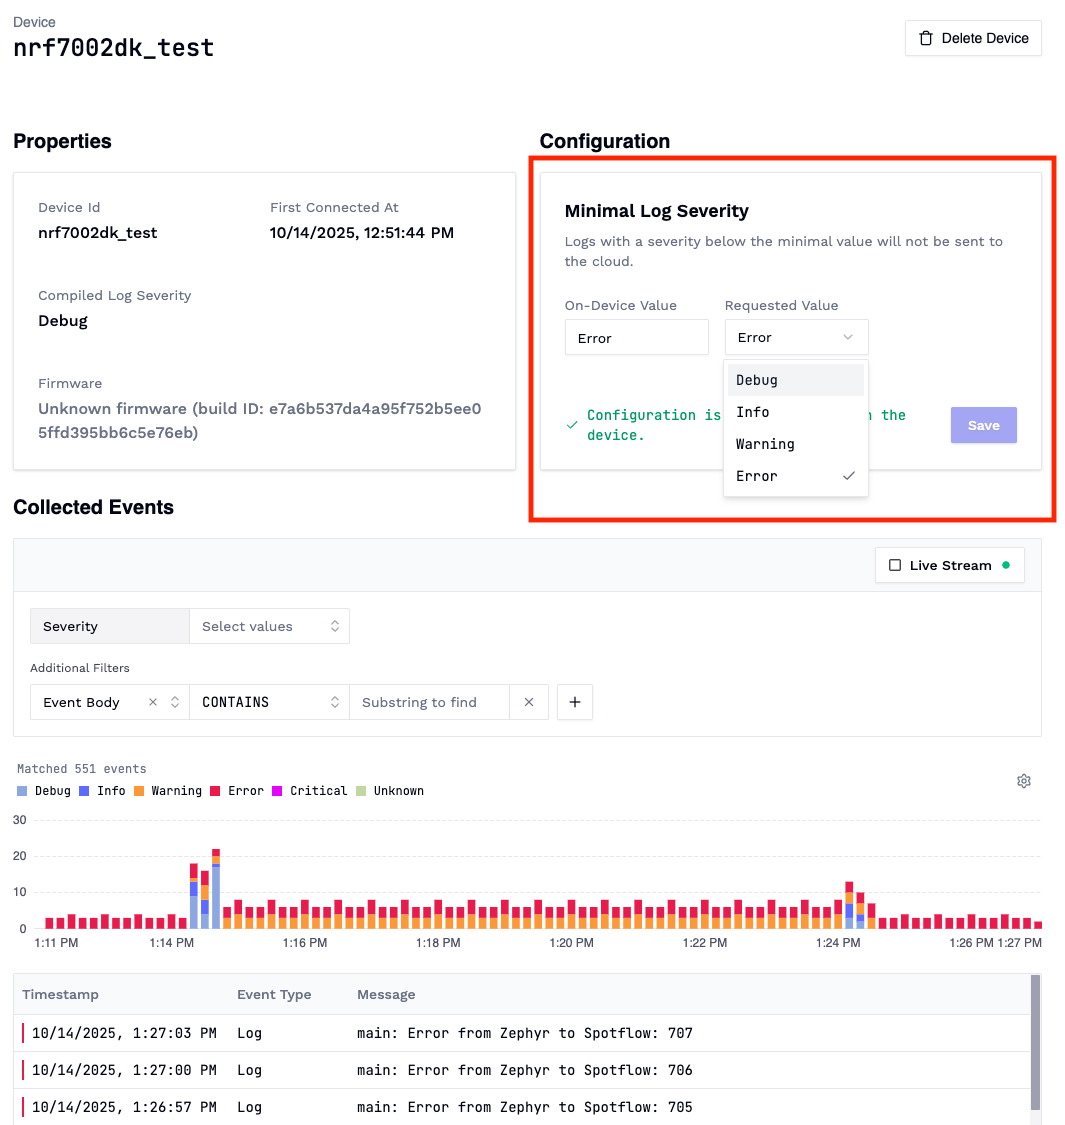
The rule of thumb is to keep production devices on ERROR and only increase verbosity to DEBUG for specific devices when troubleshooting is actually needed.
October 20th, 2025
New

Hi,
Our crash dump analysis just got a big update! You don’t have to waste hours decoding stack traces and registers anymore.
In addition to our automated GDB analysis, our AI now breaks it down, providing a clear, human-readable explanation and suggesting a fix based on the decompiled symbol file.
All crash dumps coming to the Spotflow platform are analyzed upon arrival.
AI analysis explains what went wrong in natural language based on the decompiled symbol file.
AI suggests how to fix to your firmware.
You gain the understanding in seconds, instead of hours, so you can focus on fixing your code.
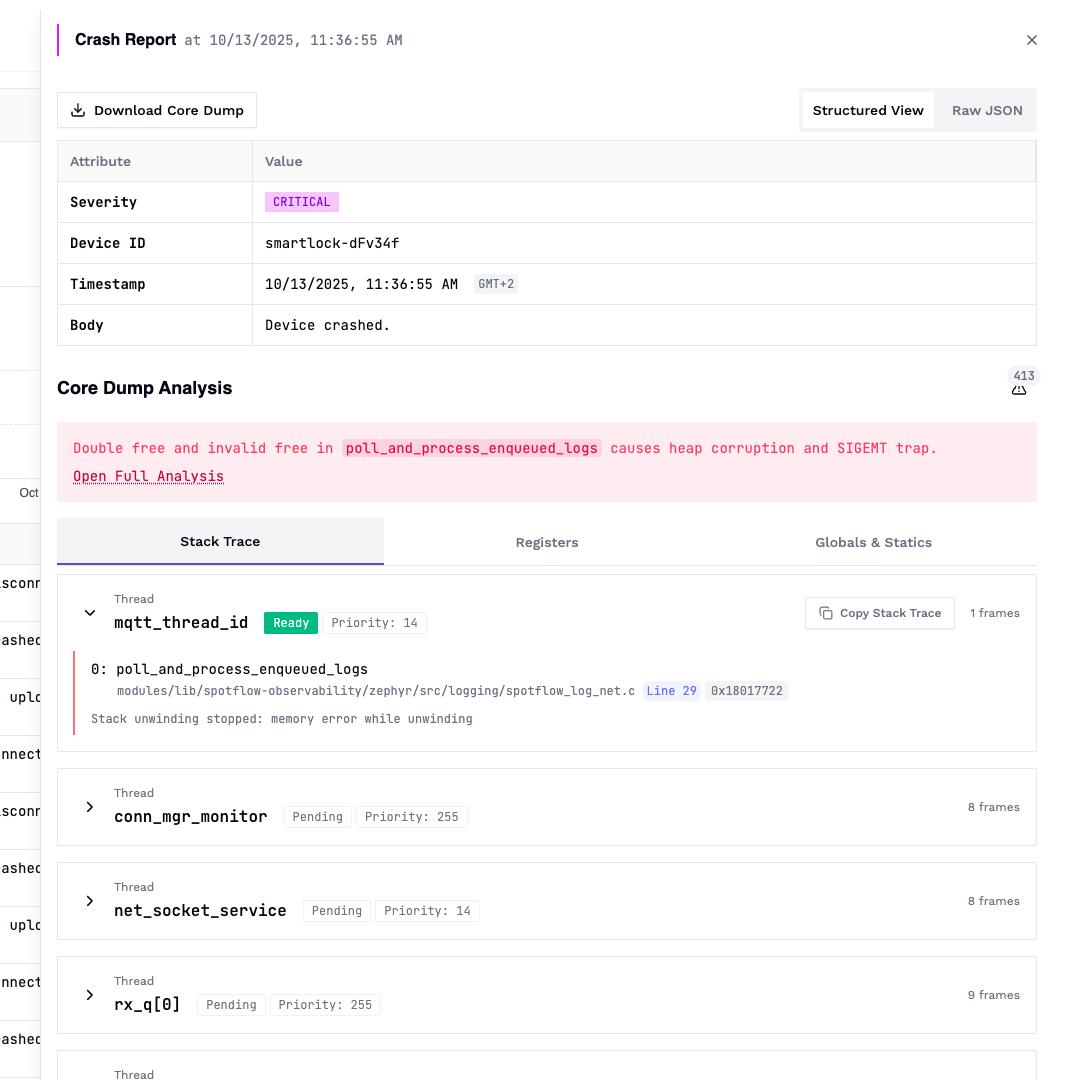
Crash report with a concise message of what went wrong:
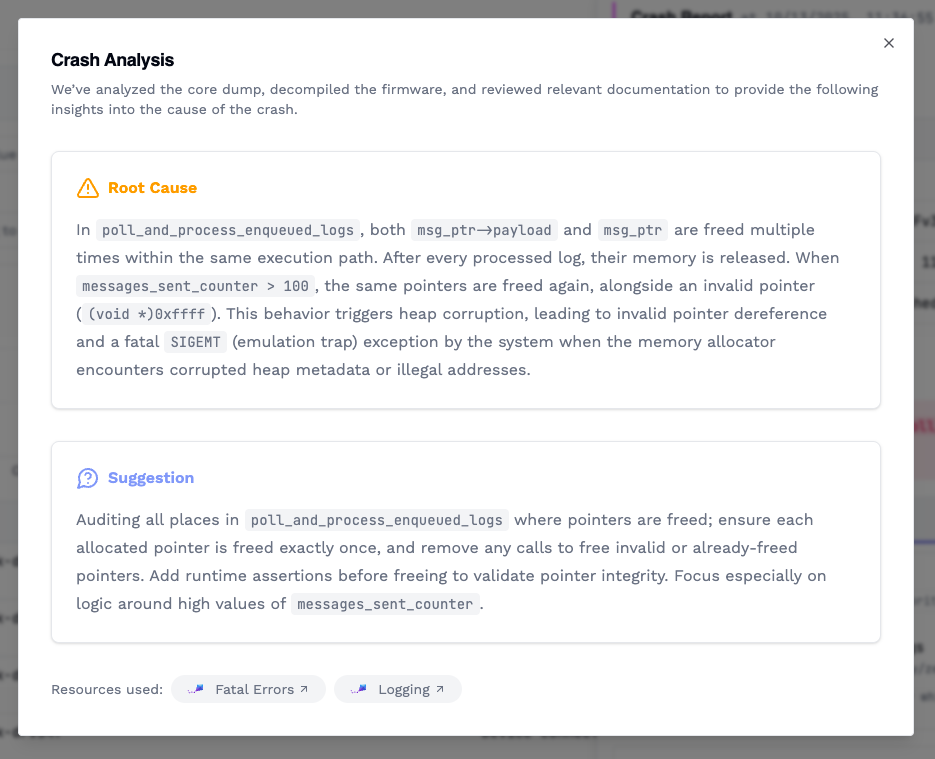
Full root cause analysis and suggested fix:
Available for all Spotflow plans, including the free tier.
August 26th, 2025
New
Automated collection from Zephyr-powered devices, just enable it via Kconfig.
Analysis via an easy-to-use web interface.
Crash reason, stack trace, registers, and variables at a glance.
Not using Zephyr? Send crash dumps via MQTT.

June 16th, 2025

It supports:
Sending logs from Zephyr-powered devices (use Spotflow as a west dependency)
Sending logs using the MQTT client (if your device is not running Zephyr)
Web portal for querying and filtering logs
Device management
Coming soon:
Sending and analyzing crash dumps
Allow users to label log template parameters, like '%d' as 'battery_level', for easier querying
Metrics support
June 3rd, 2025

Spotflow Embedded Observability has entered closed beta, and I invite you to test it out!
It supports:
Sending logs from Zephyr-powered devices (use Spotflow as a west dependency)
Sending logs using the MQTT client (if your device is not running Zephyr)
Web portal for querying and filtering logs
Device management
Coming soon:
Sending and analyzing crash dumps
Allow users to label log template parameters, like '%d' as 'battery_level', for easier querying
Metrics support