February 10th, 2026
New
Understand what's happening with your fleet
We’re introducing 2 dashboards that help you understand what’s happening across your device fleets.
Fleet overview dashboard
Device overview dashboard
Fleet overview dashboard
Use it when you’re monitoring day-to-day operations, validating a rollout, or responding to a report like “devices started rebooting” or “telemetry dropped”.
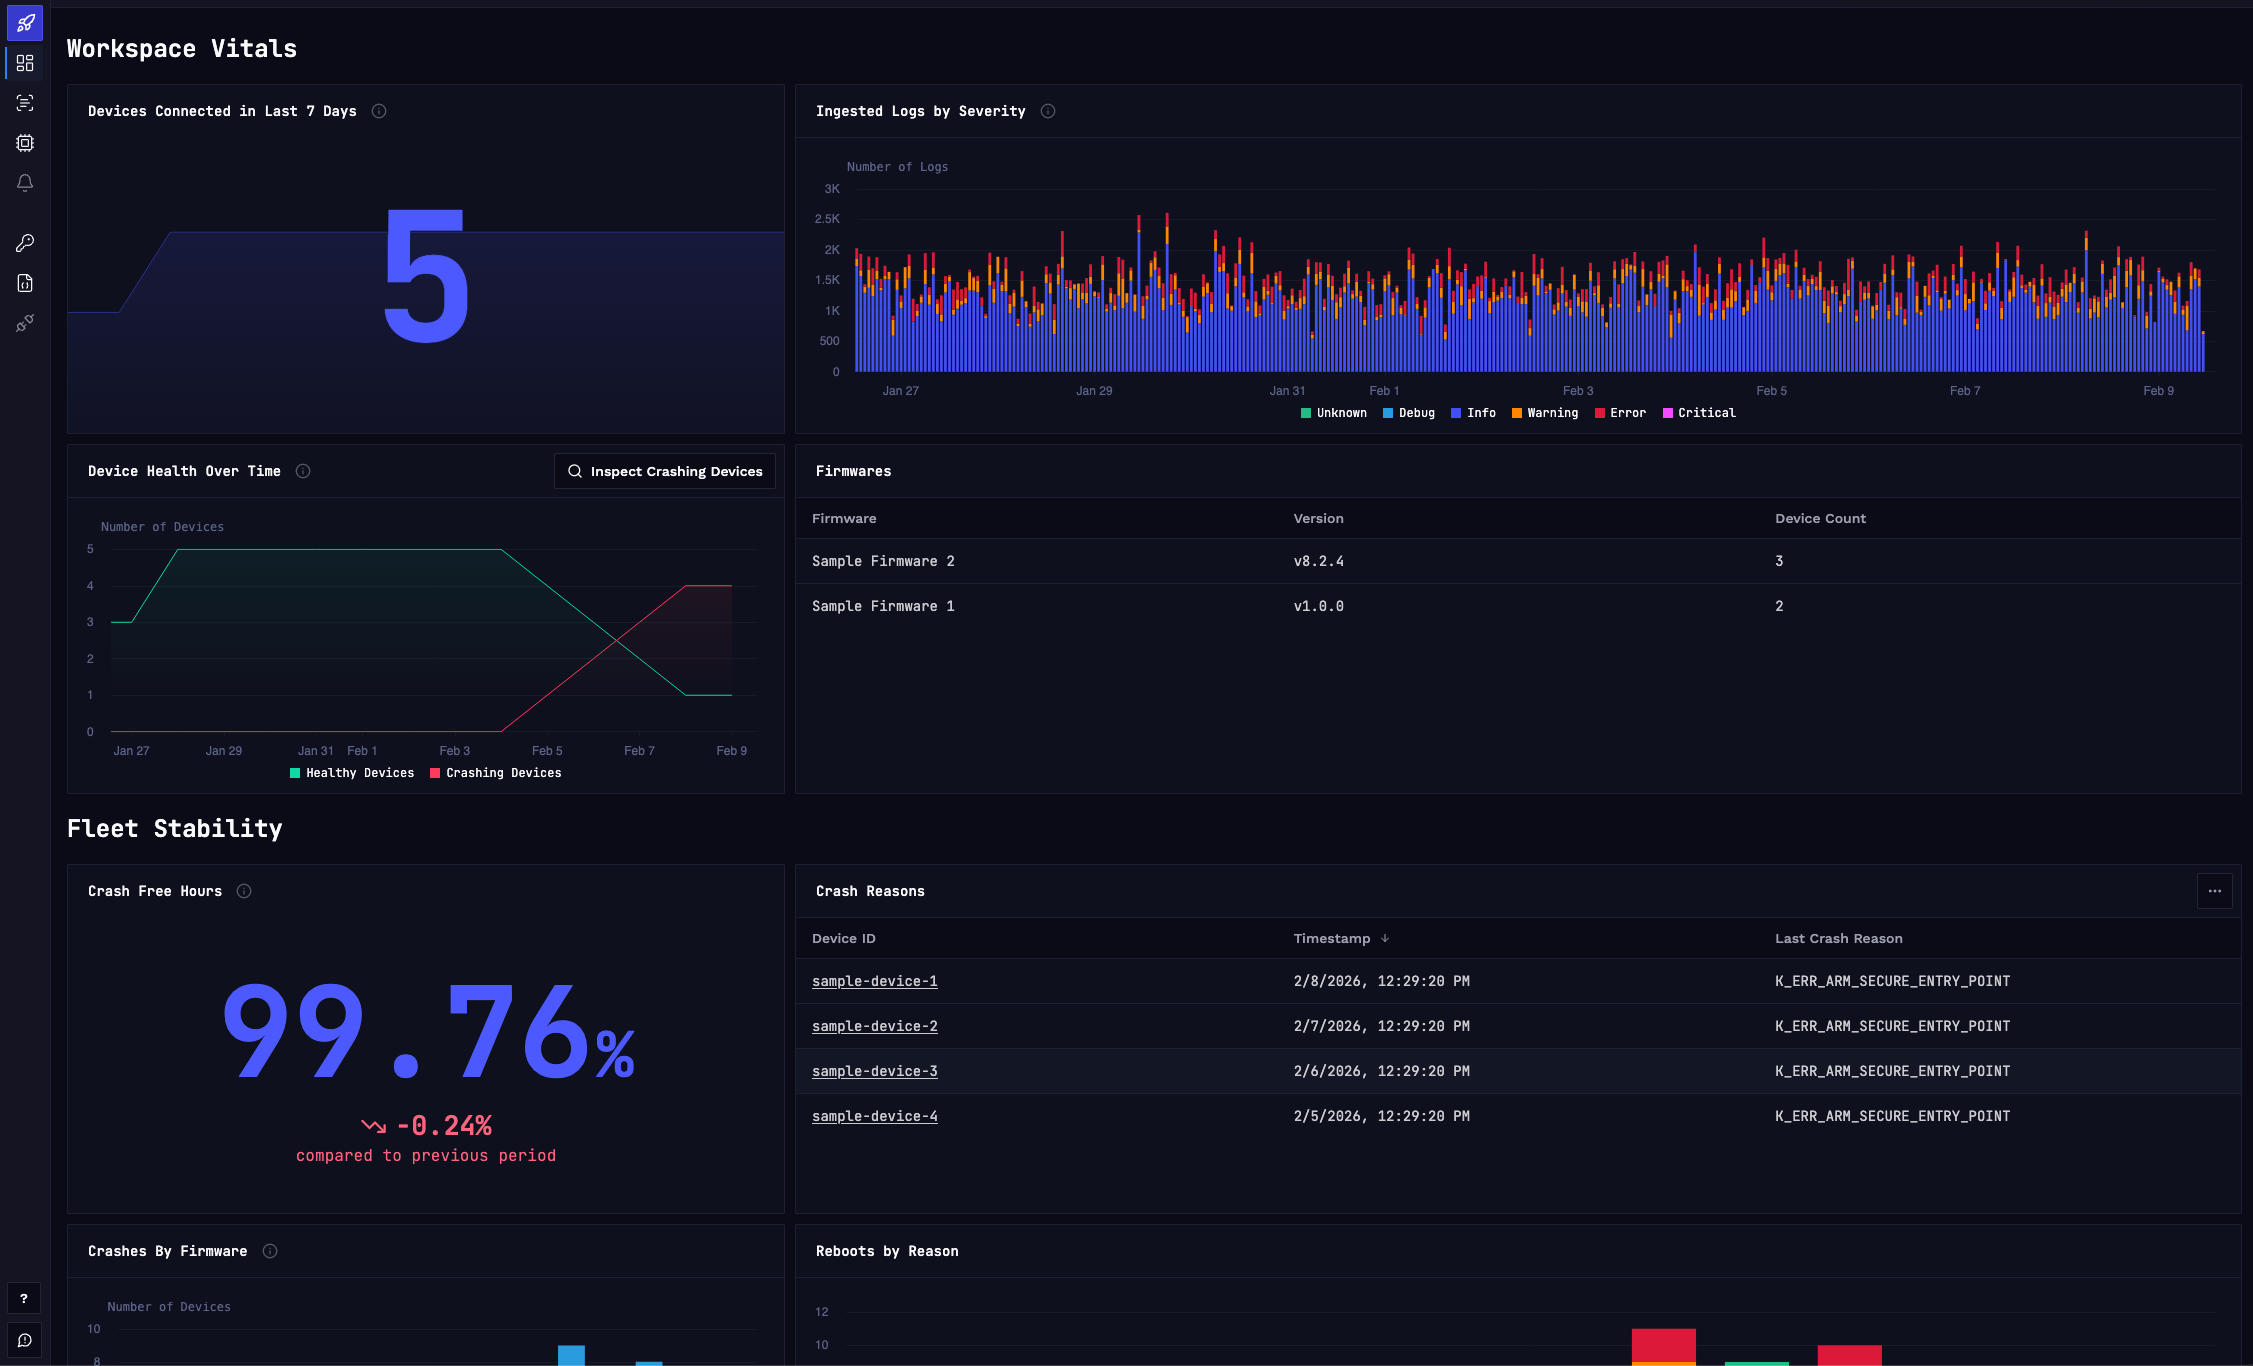
It helps you answer questions like:
Are devices connecting as expected?
Are crashes increasing, and is it tied to a rollout?
Which firmware versions are active in the field right now?
Did something change in logs (volume or severity)?
Device overview dashboard
Seeing something fishy and need to check on a specific device? The Device overview is your go-to place for understanding how a single device behaves in the real world over time.
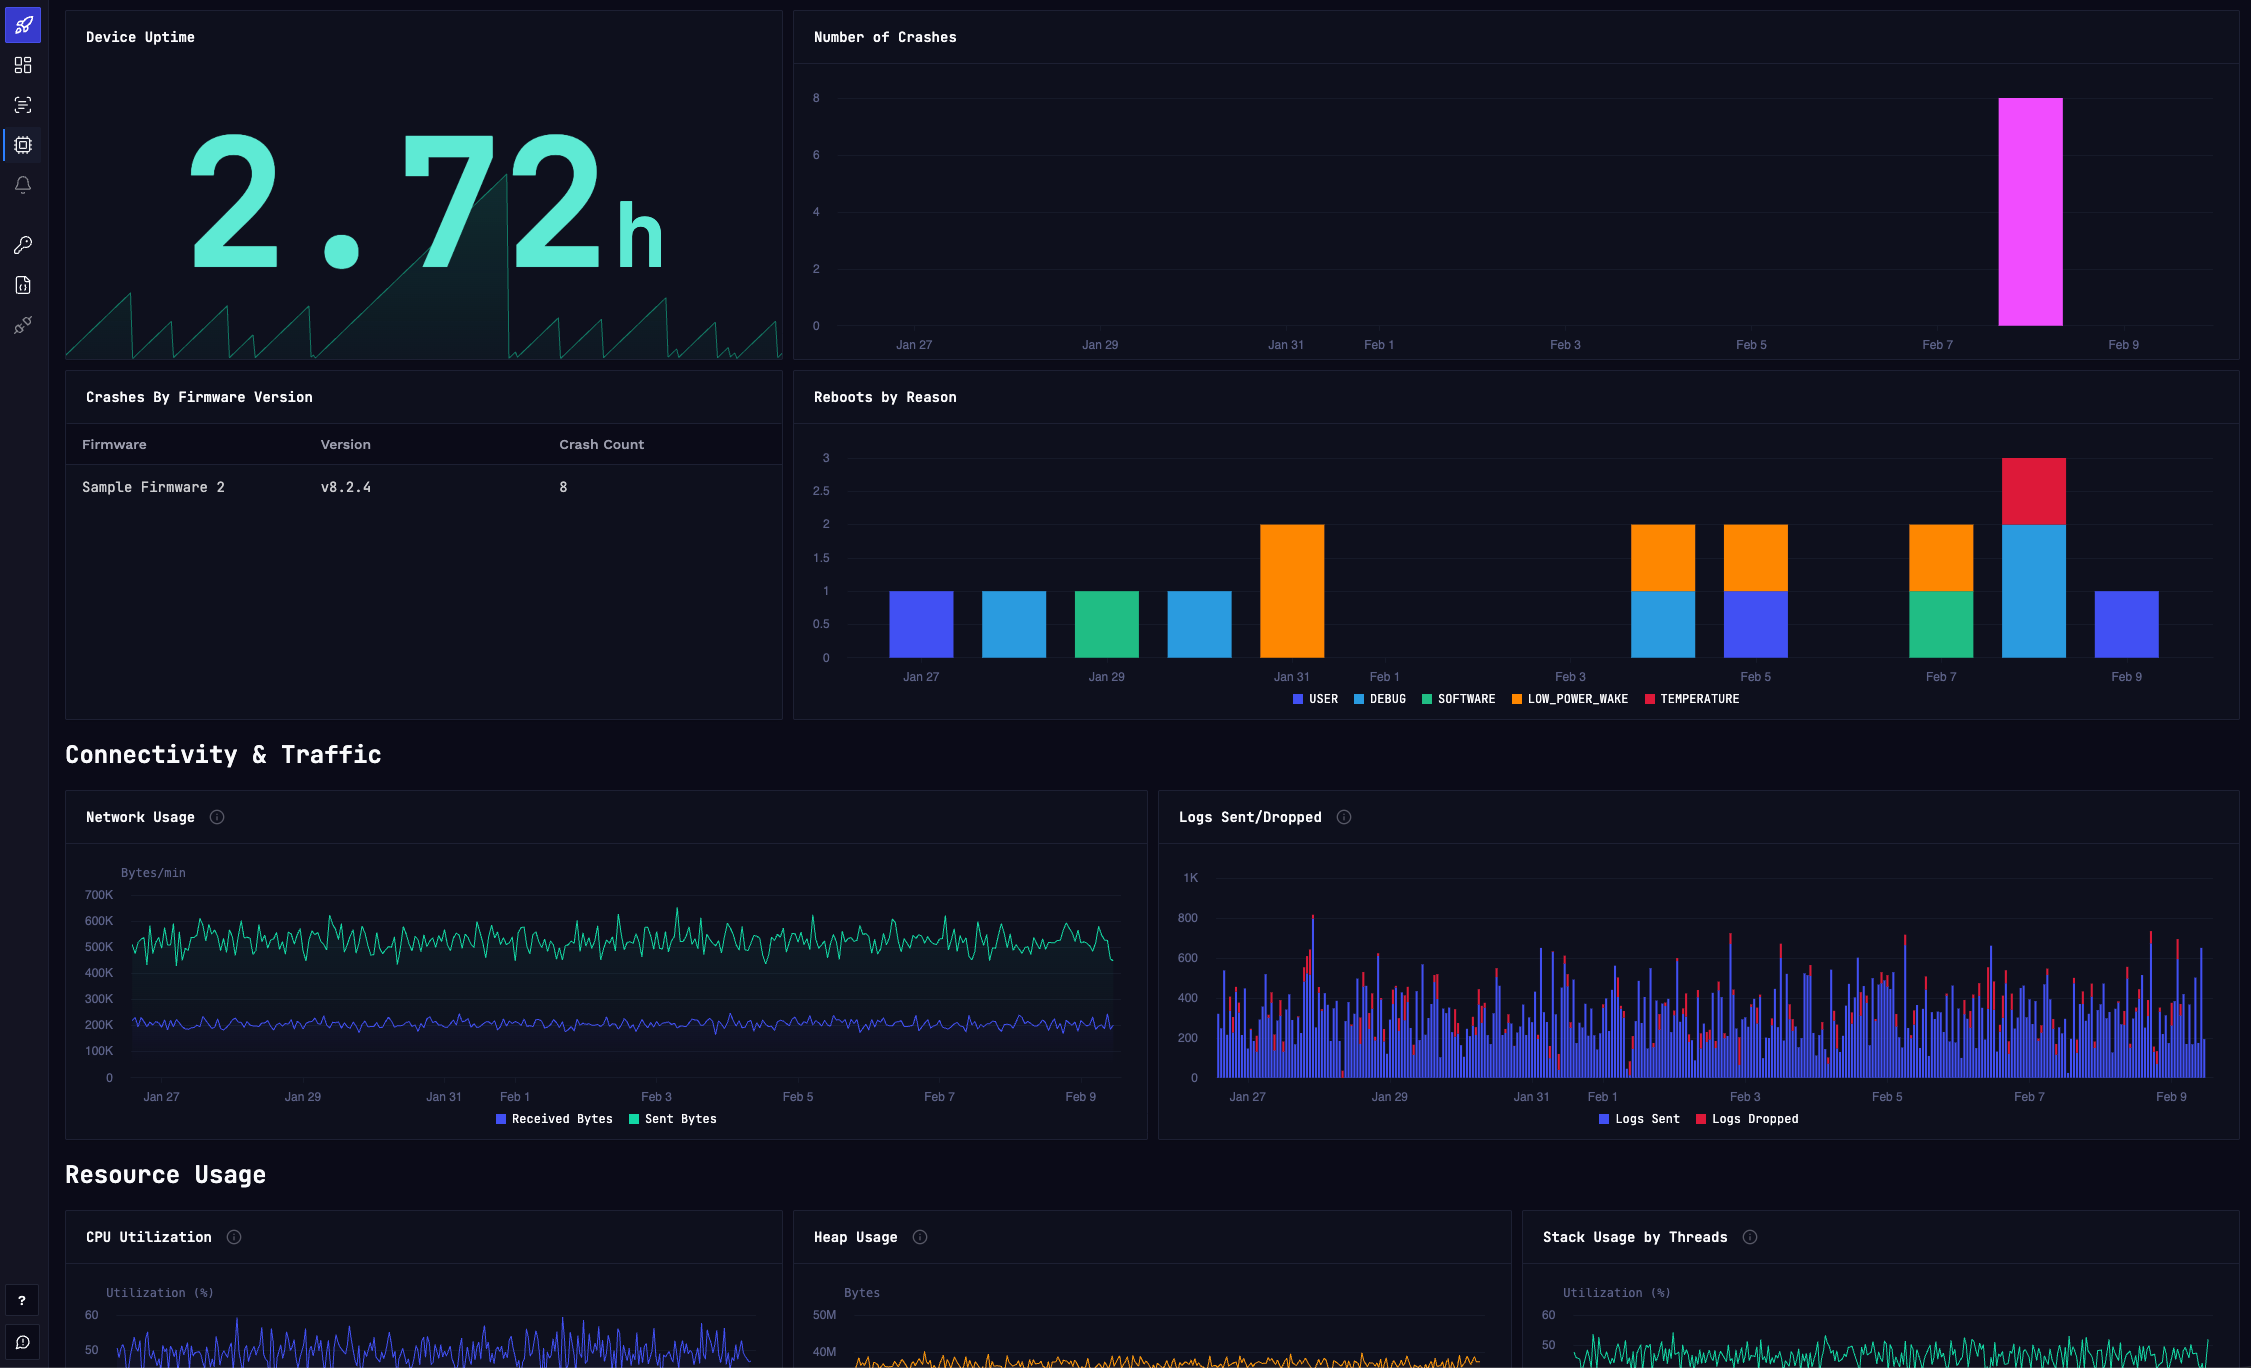
It helps you answer questions like:
Is this device stable?
Did a recent firmware update introduce crashes?
Is the device communicating reliably with the cloud?
Are we running close to CPU or memory limits?
Zephyr OS metrics are automatically collected by our device module, which runs alongside your firmware on the device. No coding needed!
The dashboards are now available for all plans, including the Free tier.
Want to learn more? Check our documentation.
Have any feedback? Join our community.